The Alliance diversity survey reveals some gaps but we only know so much.
Introduction
When Alliance magazine was planning its special feature, it wanted the issue to be informed by data on diversity in institutional philanthropy in terms of age, gender, ethnicity, class and disability. As limited data are available, Alliance decided to conduct its own survey.
Our primary focus is foundations (because foundation staff comprise most of our readers), but we also hoped to gather data about the wider philanthropy ecosystem, including philanthropy advisors, consultants and academics.
Having conducted the survey, we then asked Caroline Fiennes and Dr Helen Owen of Giving Evidence* to analyse the data, and to comment on the method and findings. This article is deliberately written in the ‘IMRAD’ structure of scientific research articles: introduction, method, results, and discussion.
Method
Alliance designed and ran an online survey, using Survey Monkey. The survey design was shaped by a recent survey on the diversity of the UK social investment field conducted by Big Society Capital, who shared its approach with us.. In addition, we also looked at a detailed qualitative survey recently conducted by BRITDOC.
The Alliance survey was sent by email to 10,489 registered contacts, and was also advertised on Twitter to Alliance’s 7,200 followers. It was also shared directly with a small number (fewer than 30) individuals in India.
The survey was open from 1 June until 30 June 2017 and 212 people responded in total – a response rate of between 1.2 per cent if Twitter followers are counted and 2 per cent if they are not. Clearly this is very low.
Alliance set out to understand the composition of people who work in philanthropy (set C). The people from whom Alliance could attempt to gather data was its registered contacts and people who see its social media posts (set B). Set B may or may not represent Set C: it is hard to know, and this research did not address that question.
Furthermore, the survey data comes only from people who answered the survey (set A). Again, the set of people who answered the survey (A) may or may not represent people who saw the survey (B), and the research did not address that question.
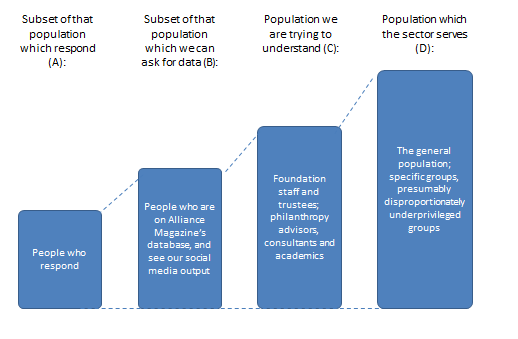
Consequently, our analysis looks at the survey responses (set A) and shows the diversity of people who answered the survey. We make some comment on the likelihood that set A is like sets B or C, but we cannot know for sure. In terms of data quality, we also assume that people answered honestly, and that each person only completed the survey once.
| Limits to what surveys tell us |
|---|
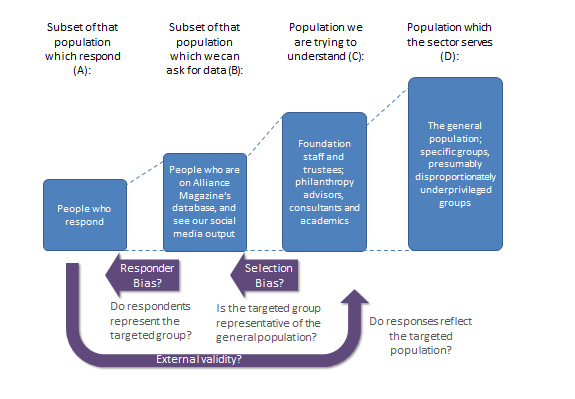
| Can the responses of people who answer a survey be taken to represent the situation of all the people in whom we are interested? In other words, are the results of a survey ‘externally valid’? Three types of bias could affect the results of this study:
● Misrepresentation bias occurs if the set of people who respond do not represent the set of people to whom the survey was sent. ● Selection bias occurs when there are systematic differences in characteristics between the people who are invited to participate in a study (set B) and the reference population (i.e. the philanthropy general population, set C). Clearly that could be the case here: for instance, if registered contacts of Alliance are better connected, or in larger organisations than people in the philanthropy sector generally. ● Response bias occurs if the people who agree to participate in a study (set A) are in some way different from those who decline to participate (set B). Again, this is quite likely here, since people who feel sufficiently strongly to spend time responding to a survey may differ from those who do not. For instance, they may be more junior, or feel more strongly about the topic of the survey. |
In addition, some questions were arguably unclear. For instance, the question on ethnicity had categories including ‘white’, ‘black’, ‘Asian’, ‘native to your country’. It is not clear how, say, a Thai person in Thailand would answer that. This imprecision introduces ‘noise’ into the data, meaning that we can’t interpret well what people are saying.
Moreover, Jérémie Chomette of France Libertés – Fondation Danielle Mitterrand, a member of the EDGE funders coalition, contacted Alliance to ask whether ethnicity itself is a useful category and criticized the fact that ‘participants need to choose between white, black, Arab, Asian, mixed and several other “ethnicities”’.
Chomette observed that: ‘White or black are some possible colours of the skin, Asian is a geographical criteria, and Hispanic is related to a language.’
These are valid criticisms and arguably one could extend this critique to the terminology of gender and disability as well. These observations will inform the design of questions in future survey work in this area.
Results
- Who answered the survey?
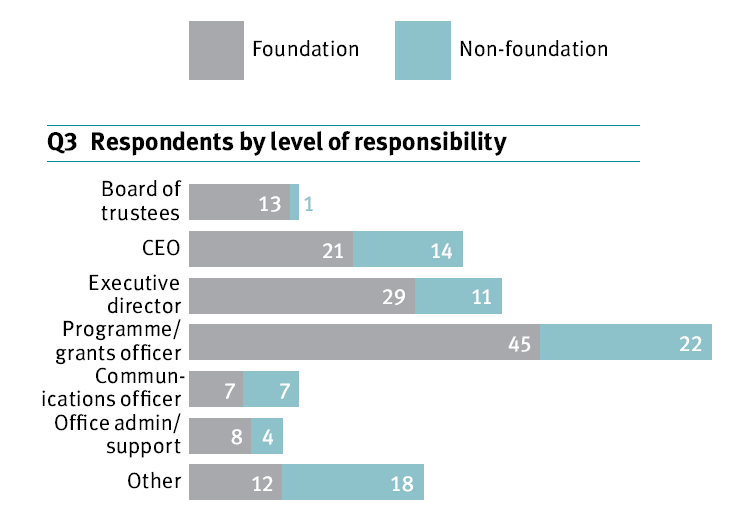
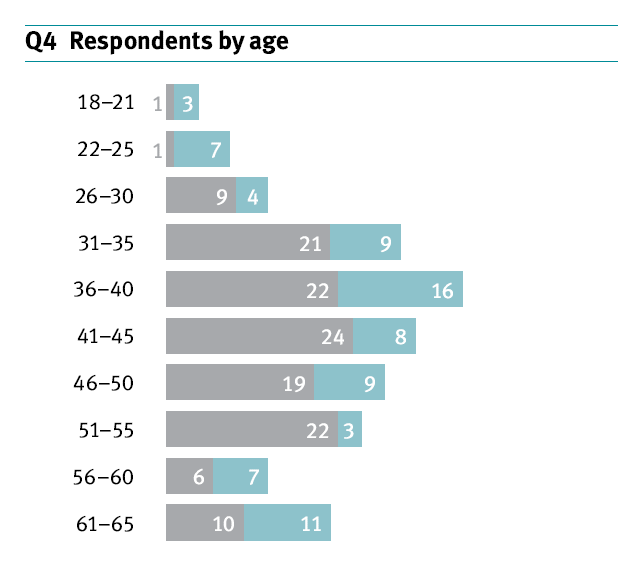
First, we show the results of the survey: these show the diversity or otherwise of the people who answered the survey.

- To what extent do people who answered the survey resemble the philanthropy sector?
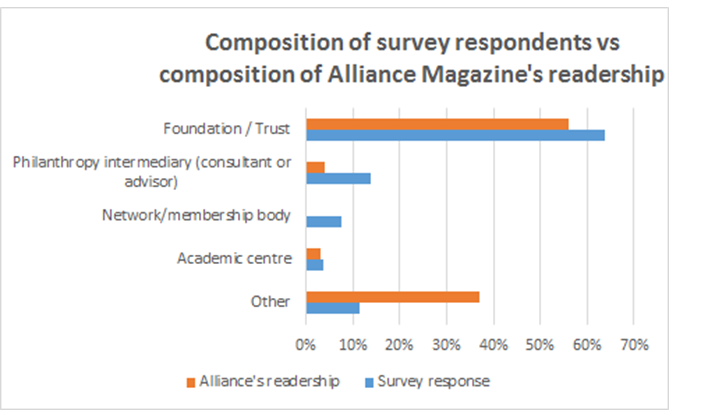
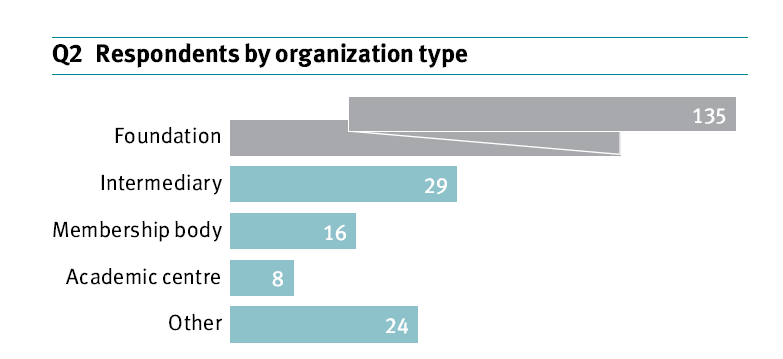
Second, we compare the people who answered the survey (set A) with Alliance’s registered contacts (set B) using data that Alliance had already gathered about the type of organization they work for. The results are below.
The survey respondents are reasonably reflective of Alliance’s registered contacts in this respect. However, the categories used were not quite aligned: for example, the survey had a category for ‘network /membership body’ while Alliance does not use this category for its contacts.
(Source: Alliance magazine)
- Is the philanthropy sector representativeof the general population and/or the population(s) which it serves?
Third, we ask whether the philanthropy sector is representative, that is, does the sector have a similar diversity mix to the general population or the specific population(s) it serves? We cannot be definitive but the picture presented by the provisional data does not look good – people who answered the survey (set A) do not well reflect the public (set D) on some important dimensions.
Resources have not allowed us to look in detail at the composition of the general public (in the various relevant countries), although some major differences between survey respondents and the general population are very clear:
- The gender split is female-skewed (74 per cent of respondents).
- Respondents are skewed to be white (64 per cent of respondents).
- Respondents appear to be more privileged than the general population. For example,
- 29 per cent of respondents went to ‘privately run or funded schools between the ages of 11 and 16’: in the UK, only 7 per cent of the total population attend private school. (We have not gathered data on these figures for other countries.)
- Furthermore, 61 per cent of respondents have parents who gained university degrees: we don’t have data for the prevalence of university degrees among people of ‘parent age’ in the general population, but imagine that it would be rather lower than 61 per cent.
Discussion
Is philanthropy out of touch with its beneficiaries?
It is clearly the case that the survey respondents do not reflect the general population, most notably in terms of how privileged they are. Worse, the philanthropy sector probably doesn’t think that it exists to serve the entire general population, but rather specific groups that are disproportionately underprivileged.
From a casual observation, one suspects that people who received free school meals – an indicator of poverty in the UK – are massively under-represented in the philanthropy sector.
One possible and often cited implication of this mismatch is that people in the philanthropy sector have limited direct lived experience of the issues facing their beneficiaries. Critics may conclude that the philanthropy sector is ‘out of touch’ with its beneficiaries, particularly if those beneficiaries are from poorer backgrounds and/or not white.
Does this mismatch matter?
Some may argue that this is not just an ethical problem for philanthropy but also undermines its effectiveness. Perhaps, but this hypothesis needs to be demonstrated. For example, William Wilberforce was never himself a slave, though was hugely sympathetic to the plight of slaves and effective in ending it.
For instance, does satisfaction of non-profit or foundation beneficiaries vary according to the extent to which its staff and leadership reflects the diversity of those beneficiaries? One could investigate this empirically, and act on the conclusions, though we know of no study in the philanthropic sector currently doing this.
One could also ask whether any other measure of non-profit or foundation success – such as the rate at which it reduces the problems it targets – is affected by the extent to which the organization’s staff and leadership reflect the diversity of beneficiaries?
These are the kind of empirical data that will really show whether, how and where diversity of staff and leadership in the non-profit and philanthropy sectors matters.
We hope this survey adds to the limited but growing body of knowledge about philanthropic diversity worldwide. The US Council on Foundations’ annual benchmarking report is a notable (and noble) contribution. The absence of such data raises questions about institutional philanthropy’s commitment to understanding issues of diversity and taking active steps to change the diversity mix.
Caroline Fiennes is director of Giving Evidence.
Email caroline.fiennes@giving-evidence.com Twitter @carolinefiennes
Dr Helen Owen is a research consultant at Giving Evidence.
Email helen.owen@giving-evidence.com
Charles Keidan is editor of Alliance.
Email charles@alliancemagazine.org
*Giving Evidence is a philanthropic consultancy that encourages and enables charitable giving based on sound evidence.

Comments (0)